New version of PA² Software, including coverage, from Peening Accessories. Continuation from MFN September 2016, vol. 17 issue; practical aspects (2/2).
In the first part of this paper, it was shown how algorithms and computers could help in quantifying the coverage rate of the peening process. Hereafter, some of the main practical aspects will be described.
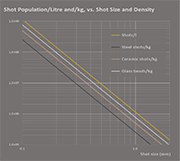
Shot size and shot density
The number of shots per liter is only dependent on the shot size (Chart 6).
If the shot size is divided by 2, then, the amount of shots/l is multiplied by 23 = 8; i.e.: there are 42.3 million of 0.3 mm shots in one liter and "only" 5.3 million of 0.6 mm shots in one liter.
For a given shot size, the number of shots per unit of mass is decreasing when the shot density is increasing. If steel shot is taken as a reference, the ratio is approximately 1/2 for ceramic shot and 1/3rd for glass beads:
I.e. for 0.3 mm shot:
• Glass beads -> 28.3 million shots/kg
• Ceramic shot -> 18.4 million shots/kg
• Steel shot -> 9.3 million shots/kg.
Influence of shot wear and Peening (Almen) intensity
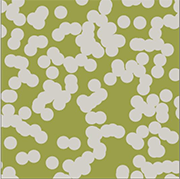
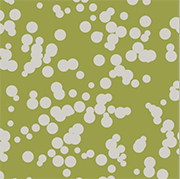
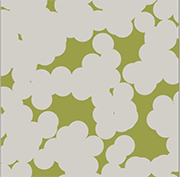
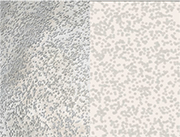
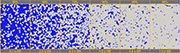
Picture 6 is simulating coverage, using 0.6 mm cut wire shot, as new. Pictures 7 and 8 are showing the coverage rate variation, with shot size reduction and then, Peening (Almen) intensity increase, using always the same 180-crater production. The artificial background is simulating fluorescent coverage tracer.
Overlapping analysis
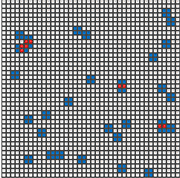
The area for modeling is gridded; using 40 by 40 = 1600 cells (spots). Each crater is randomly located and represented with four cells, each having a value of "1" (Pict. 9).
In reality, the craters are nearly round and may have intersection area from almost 0% to 100%. The square crater shape is a good approach to make computation easier. Then, the minimum intersection area is 25%. Therefore, intersection possibilities are 25, 50 or 100%. When overlapping occurs, inside the intersection area, the cells values of each crater are added. This process is easy to understand when coverage is low (Pict. 9).
For a given amount of coverage, the number of cells among the 1600 total ones to be different from zero can be easily calculated by proportional law. Then, by Monaco principle, the individual craters are randomly located and each of their four cells receives a value taking into account the intersections with the other ones. The cells are then colored from white for "0", to blue for medium overlapping value and to red for -maximum overlapping value.
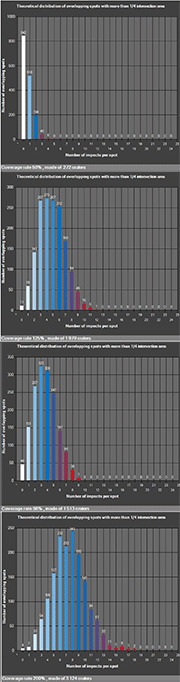
• For poor coverage, below 50% (chart 7, top left), the overlapping spectrum is squeezed at the left, with two tall bars representing "no overlapping", with no, or one impact per cell. No cell with more than four impacts.
• For 98%, standard coverage, (chart 7, top right), the overlapping spectrum is moved to the right and is well balanced. Since this is the definition of 98% coverage, 40 cells over 1600 remain virgin. Seventy percent of the area is overlapped with 2 to 5 impacts at the same spot. No cell has more than 9 impacts; the red portion represents now more than 7% of the area showing 7 to 9 impacts at the same spot.
• For 125% coverage, which is a very common specification (chart 7, bottom left), the overlapping spectrum starts widening with 85% of the area showing overlapping with 2 to 7 impacts at the same spot. Ten percent of the area is overlapped with 8 to 12 impacts at the same spot. No cell with more than 12 impacts.
• For 200% coverage, which is not recommended and hardly specified, except for low intensity peening or in very specific purposes, the spectrum is very wide, but still 0.25% of the area is virgin! The maximum overlapping is 18 impacts at the same spot, which creates a serous gap with the majority of the surface, showing 5 to 10 impacts at the same spot. Under high intensity, the risk is folding, crack initiation, scaling and cavity creation, thereby potentially sheltering corrosion (Pict. 10).
Coverage prediction
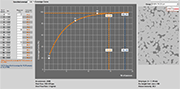
After establishing Peening (Almen) intensity and saving all data and intensity results in a PA² Software file with ".alm" extension, it is then possible to start coverage characterization (Pict. 11).
The operator estimates and inputs the coverage for a given peening amount, not necessarily one pass. In cases when several measurements are made for the same peening amount, the average value will be input.
Based on this first value, PA² Software immediately proposes coverage values for each peening amount, in the right column (values in orange color) and draws the curve accordingly, predicting the time to reach 98% and the time to reach specified coverage.
Then, the operator inputs, at least, two other coverage values for different peening amounts. The recommendation is to give, at least, a measurement value around 98%.
At the screen right, the operator can display some real or artificial reference pictures to help in the evaluation of the coverage rate.
PA² software, main features
Main Inputs
Shot size distribution, picture size, peening intensity range, shot mass flow rate, coverage measurement for a given peening time, specified coverage rate.
Main Results
Mean shot size, crater size and depth, time for 98% coverage and time to reach the specified coverage, overlapping map and overlapping spectrum...
Examples in Automatic assistance
Forecast of next coverage values, automatic generation of a best fitting curve, display of computer generated and real reference pictures (Pictures. 12, 13).
References
[1] Avrami M, J. Chem. Phys., 7, 1103, 1939; lbid., 8, 212, 1940; lbid., 9, 177, 1941.
[2] Knotec O and Elsing R, Computer simulation of different Surface Topographies of Metals Produced by Blasting Process, ICSP3, p361-368, 1987.
[3] SAE Standard J2277, Shot Peening Coverage Determination, revised 2013-04-24.
|
The Author: PA² Software, designed and distributed |